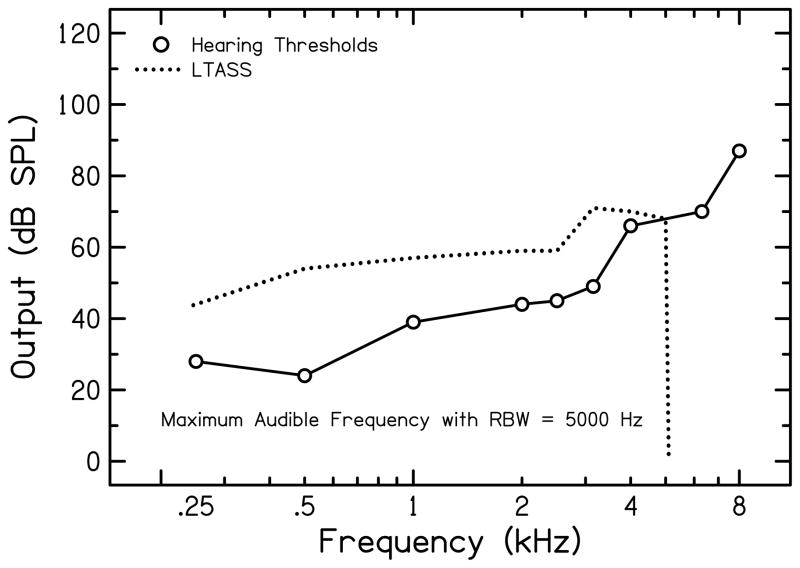
Figure 3.
Amplified long-term average speech spectrum (LTASS) for a representative participant. The dashed line represents the amplified LTASS and the circles represent behavioral thresholds. The frequency at which the thresholds intersect the LTASS is the maximum audible frequency (MAF) for restricted bandwidth (RBW: for this participant 5000 Hz).

