Figure 1.
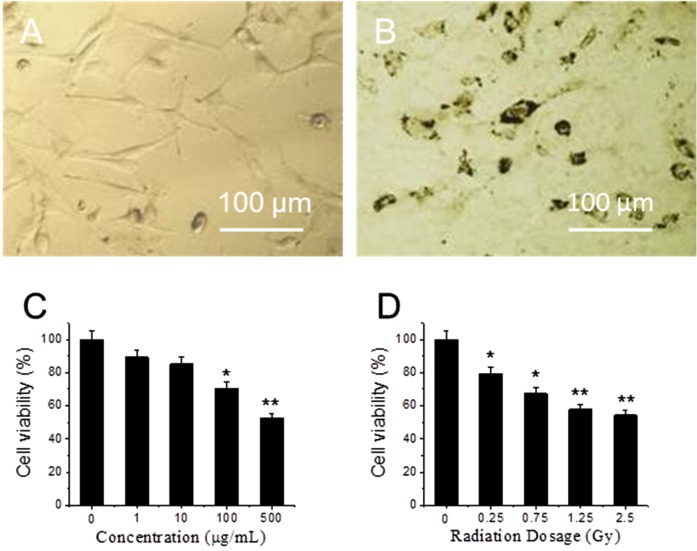
Optical images of cells (A) and cells treated with graphene oxide (GO) for 24 h (B); cytotoxicity of cells treated with different concentrations of GO (C); and exposed to different dose of X-ray (D). “*” (p < 0.05) and “**” (p < 0.01) represent significant difference and extra significant difference, respectively.

