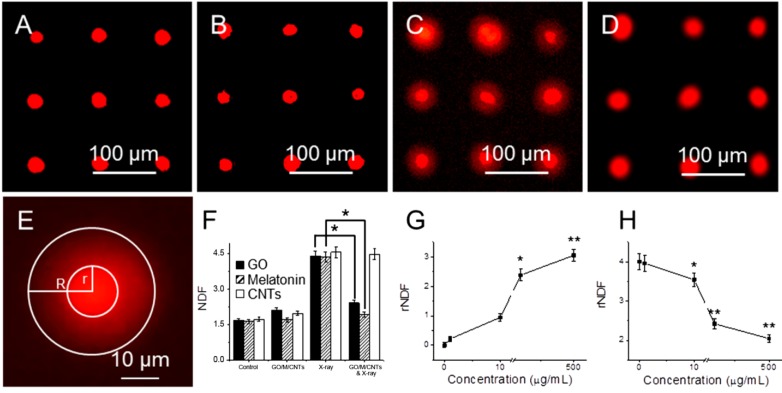
Figure 2.
Genotoxicity of cells treated with GO and X-ray irradiation with halo assay. Fluorescent images of arrayed cells (A); cells treated with 10 µg/mL GO (B); cells exposed to 1.25 Gy X-ray (C); and cells treated with GO and then exposed to 1.25 Gy X-ray (D); an enlarged image shows that halo and nucleus (E); the NDF values of cells after different treatment (F); the rNDF values of cells treated with different concentration of GO without (G) and with 1.25 Gy X-ray radiations (H). “*” (p < 0.05) and “**” (p < 0.01) represent significant difference and extra significant difference, respectively.

