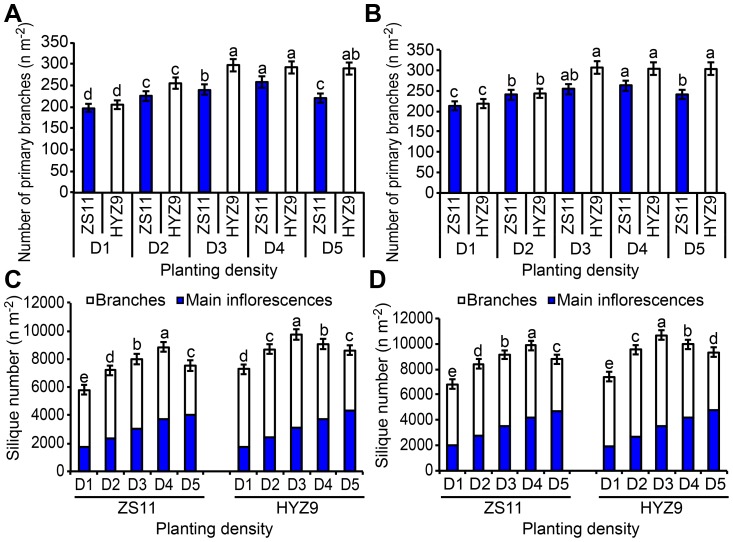
Figure 2. Numbers of primary branches and siliques per unit area of ZS11 and HYZ9 at five planting densities in 2010–2011 and 2011–2012 growing seasons.
(A) and (B) Number of primary branches per unit area of ZS11 and HYZ9 in 2010–2011 and 2011–2012, respectively. (C) and (D) Number of siliques per unit area of ZS11 and HYZ9 in 2010–2011 and 2011–2012, respectively. Different lower case letters indicate significant pairwise differences between means (p<0.05; Duncan's test).

