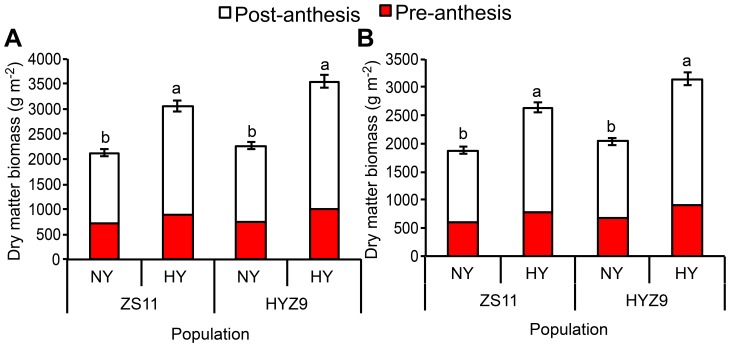
Figure 7. Dry matter biomass at pre-anthesis and post-anthesis in the normal-yield (NY) and high-yield (HY) populations of ZS11 and HYZ9 in 2011–2012 and 2012–2013 growing seasons.
(A) Dry matter biomass at pre-anthesis and post-anthesis in the NY and HY populations of ZS11 and HYZ9 in 2011–2012. (B) Dry matter biomass at pre-anthesis and post-anthesis in the NY and HY populations of ZS11 and HYZ9 in 2012–2013. Different lower case letters indicate significant pairwise differences between means (p<0.05; Duncan's test).

