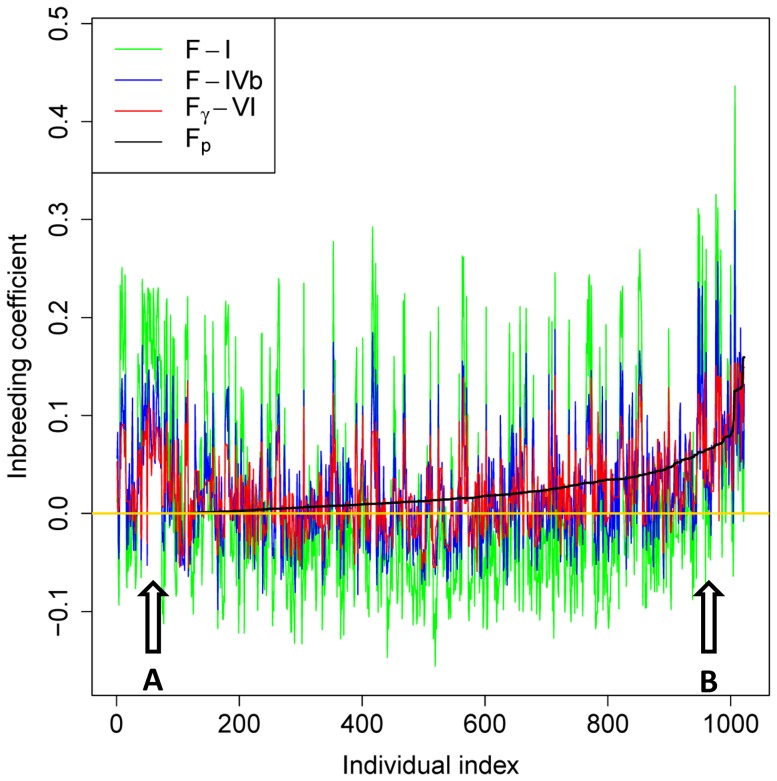
Figure 3. Comparison of three methods for calculating genomic inbreeding coefficients with pedigree inbreeding coefficients using a swine sample of 1022 individuals with genotyped parents.
The three representative genomic methods for estimating inbreeding coefficient mostly had similar patterns of deviations from the pedigree estimates, but F-I (Method i) had the largest variations and Fγ-VI (Method iv) had the smallest variations. For the group of individuals marked by ‘A’, all three genomic methods had high inbreeding coefficients whereas the pedigree method had ‘0’ inbreeding coefficients. For the group of individuals marked ‘B’, all three genomic methods had lower inbreeding coefficients than the pedigree estimates that were among the highest inbreeding coefficients in this sample.

