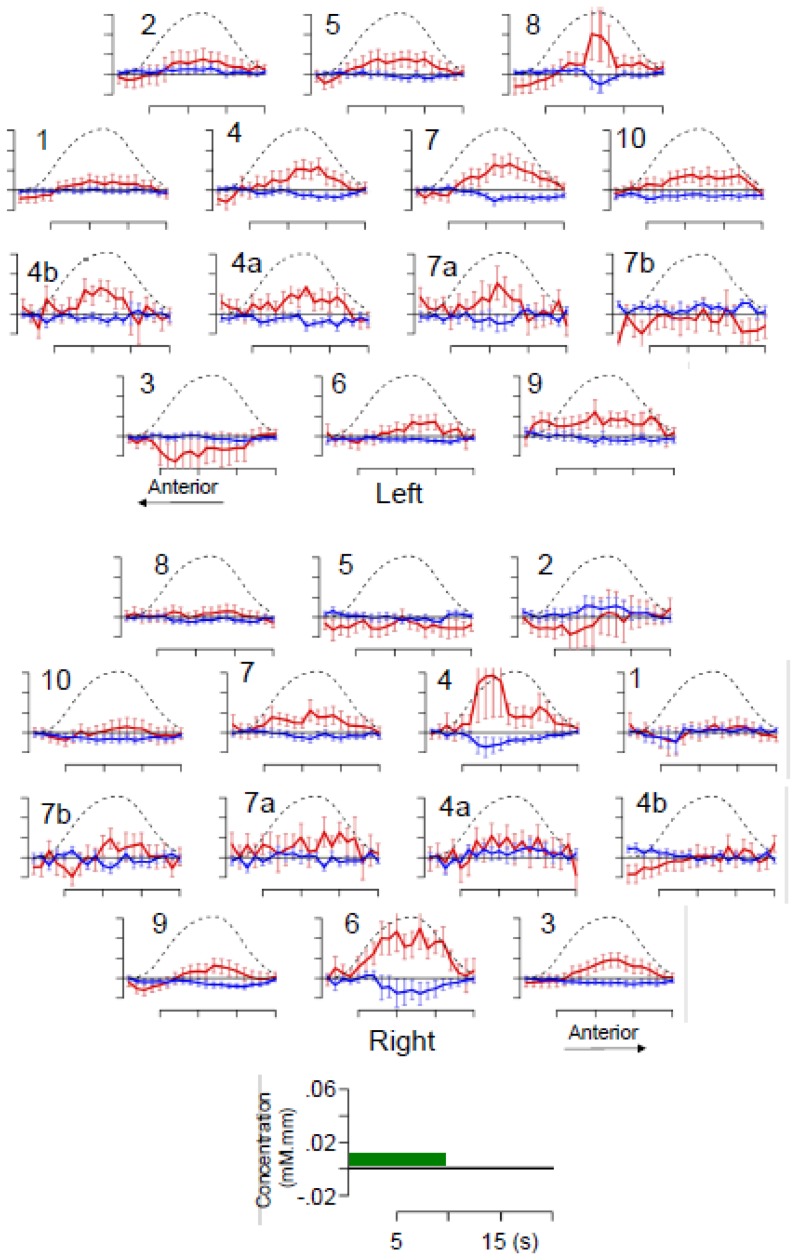
Figure 3. Average time course of the hemoglobin changes following auditory stimulation in individual channels revealed by a general linear model.
The trace in red represents oxyHb, in blue deoxyHb; the error bars indicate standard error (over participants). The zero level or baseline is defined as the intercept of the linear model. The black dotted lines show the standard HRF model convolved with the average duration of stimulation, scaled to the maximum average concentration. The scale as well as the timing of stimulation (green box) are shown in the reference axes.

