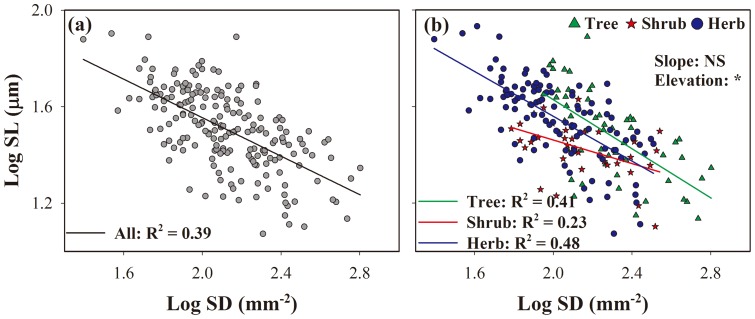
Figure 2. Relationship between stomatal density (SD) and stomatal length (SL) at the species (a) and plant functional type (PFT, b) level.
“Slope”, difference in standardized major axis (SMA) slopes; “Elevation”, difference in SMA elevations (y-intercept); NS, not significantly different; *, significantly different (P<0.05). All regression lines shown in each panel are significant (P<0.01).

