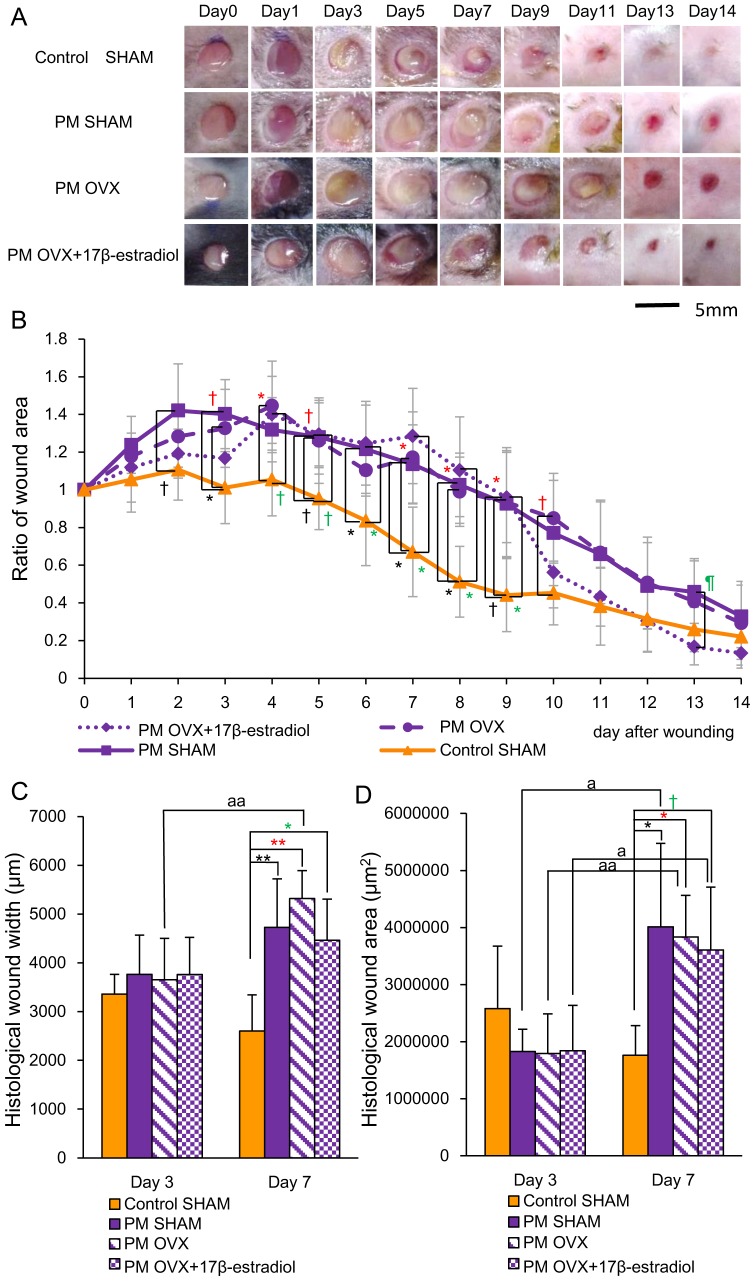
Figure 3. Macroscopic wound healing and histological wound width and wound area.
(A) Four-mm-diameter wounds were inflicted and healing was recorded by photography. Bar, 5 mm. (B) Ratios of wound areas to initial area on day 0 are shown on line graphs for each day. (C) Histological wound width (µm) and (D) histological wound area (µm2) are shown on box graphs. Values are expressed as mean ±SD, n = 4–6 for each group, ANOVA, Tukey-Kramer †p<0.1, *p<0.05, **p<0.01 (in black): Control SHAM versus PM SHAM, †p<0.1, *p<0.05, **p<0.01 (in red): Control SHAM versus PM OVX, †p<0.1,*p<0.05 (in green): Control SHAM versus PM OVX+17β-estradiol and ¶p<0.05 (in green): PM OVX+17β-estradiol versus PM SHAM, and t-test ap<0.05, aap<0.01: day 3 versus day 7.

