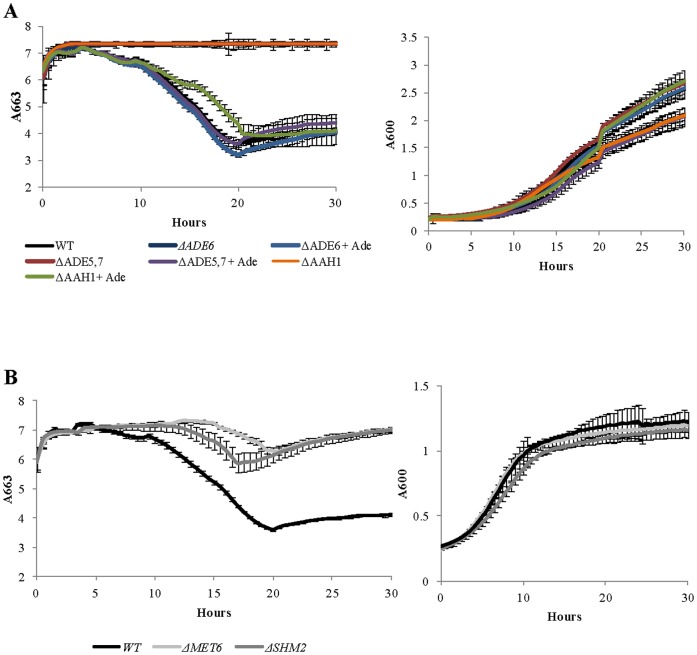
Figure 4. Influences of mutants in purine metabolism on cysteine catabolism to H2S.
A Extracellular release of cysteine-generated H2S (left panel) and growth curves (right panel) from wt and mutants in purine biosynthesis pathway, with and without adenine supplementation. B Extracellular release of cysteine-generated H2S (left panel) and growth curves (right panel) from wt and mutants in folate derived one-carbon metabolism. H2S formation was measured at 663 nm using detection-dye; discolouration of the dye represents release of H2S. Experiments were carried out in a microtiter plate. Error bars represent the standard deviation for quadruplicate experiments.

