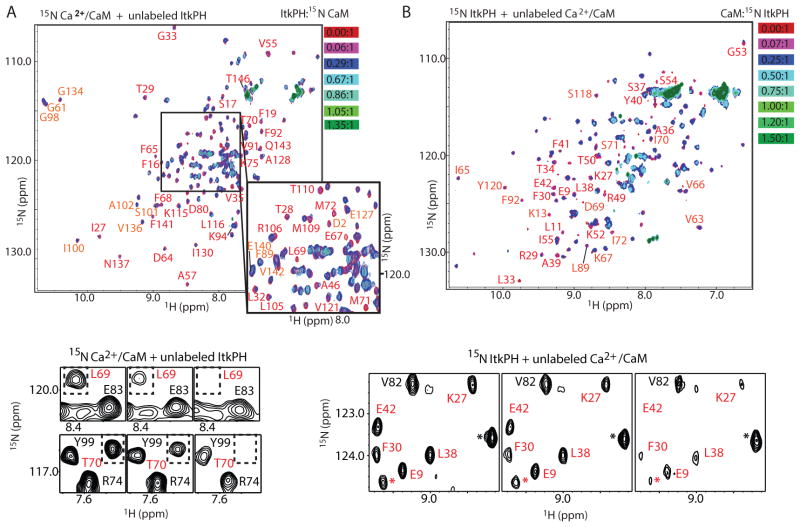
Fig 2. Structural characterization of the binding interface between the Itk PH domain and CaM.
(A) (top) Overlay of 1H-15N-HSQC spectra of 150 μM 15N-Ca2+/CaM with unlabeled Itk PH domain titrated at indicated molar ratios (red to green); residues with the largest spectral changes upon binding are labeled. (bottom) Representative regions of the 1H-15N-HSQC spectra for the first three points in the titration showing line-broadening of the selected CaM resonances (labeled in red and boxed). Resonances that show only partial line broadening are labeled in black. (B) (top) Overlay of 1H-15N-HSQC spectra of 300 μM 15N-ItkPH with unlabeled Ca2+/CaM titrated at indicated molar ratios (red to green); residues showing significant spectral changes are labeled. (bottom) Representative regions of the 1H-15N-HSQC spectra for the first three points in the titration showing line-broadening of the selected Itk PH domain resonances (labeled in red). Resonances that show modest line broadening (presumably due to increased molecular weight of the complex rather than direct interaction with CaM) are labeled in black. Asterisk (*) indicates resonances that could not be unequivocally assigned.

