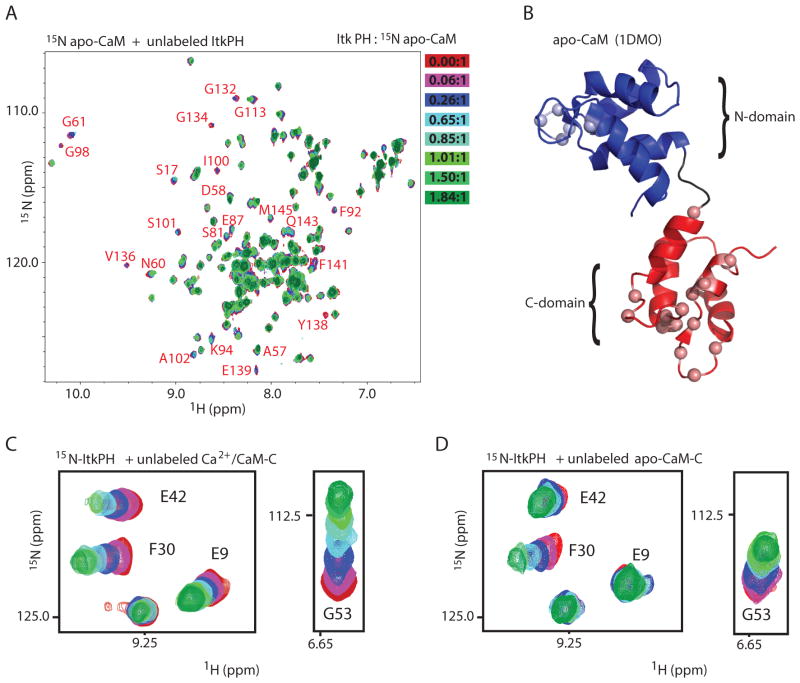
Fig 4. Binding of apo-CaM and the CaM C-domain to the Itk PH domain.
(A) Overlay of 1H-15N-HSQC spectra of 150 μM 15N-labeled apo-CaM with increasing amounts of unlabeled Itk PH domain titrated at the indicated molar ratios (red to green); resonances that exhibit the largest spectral changes throughout the titration are labeled with the corresponding residue. (B) Residues exhibiting the most change mapped onto the structure of apo-CaM (PDB entry 1DMO) are represented as spheres. (C, D) Unlabeled Ca2+/CaM-C (C) or apo-CaM-C (D) was titrated into 300 μM 15N-labeled Itk PH domain at molar ratios identical to that used in Figure 2C ([CaM] increases from red to green). Selected regions of the HSQC spectra from the titration are shown; resonances showing the largest chemical shift changes are labeled in (C) and the same resonances are indicated in (D).

