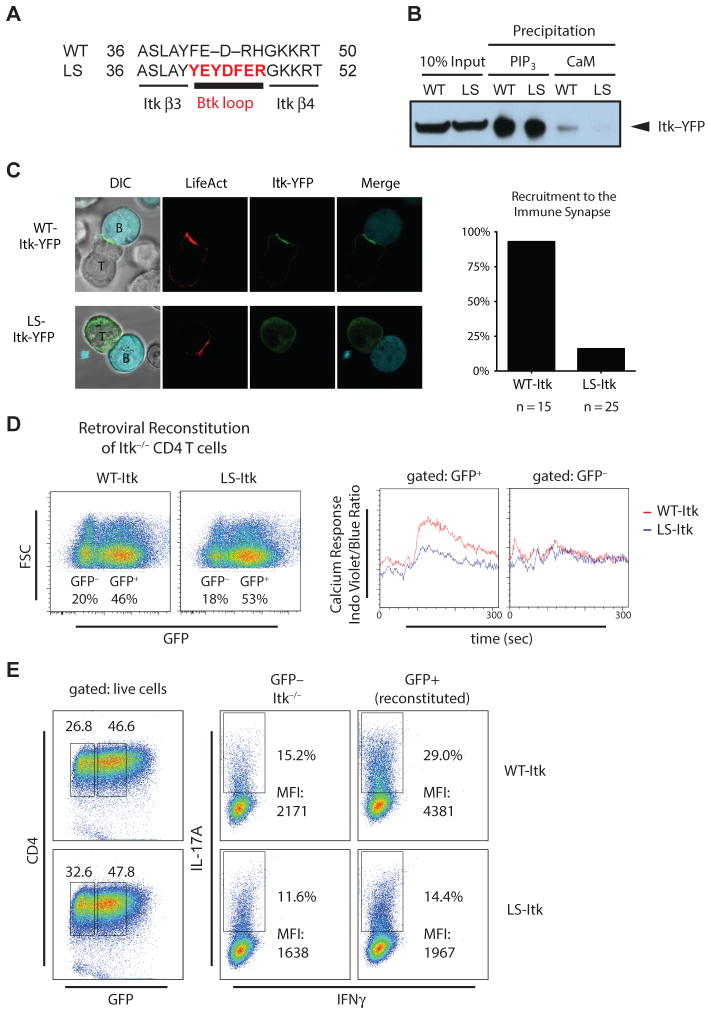
Fig. 6. A Itk mutant that cannot bind CaM is not recruited to the immune synapse in Jurkat T cells, and Itk-deficient CD4 T cells reconstituted with mutant exhibit reduced Ca2+ signaling and IL-17A production.
(A) LS)-Itk was generated by replacing the 5 amino-acid β3/β4 loop in Itk PH domain with the corresponding 7-amino acid loop from Btk. (B) Ability of LS-Itk to bind CaM and PI(3,4,5)P3 in vitro. Cell lysates from HEK293 cells transfected with WT or LS-Itk were assessed for Itk binding to Ca2+/CaM or PI(3,4,5)P3 by co-precipitation assay. Data are representative of 3 experiments. (C) Jurkat T cells expressing pRuby-LifeAct and WT- or LS-Itk-YFP fusion proteins were conjugated to Daudi (Turquoise-labeled) B cells in the presence of SEE super-antigen. Actin (red) and YFP (green) colocalization was assessed by confocal microscopy and quantified. (D) Primary Itk-deficient CD4+ T cells reconstituted with retrovirus expressing WT-Itk or LS-Itk and bicistronic GFP were loaded with Indo-1 and stimulated with antibodies against TCR subunits to detect changes in cytosolic Ca2+ amounts, which are plotted at the right as a ratio of Indo-1 Violet to Indo-1 Blue over time. GFP− and GFP+ T cells represent nontransduced and transduced cells, respectively. Data are representative of 3 experiments. (E) Primary Itk-deficient CD4+ T cells reconstituted with retrovirus expressing WT- or LS-Itk were induced to differentiate into TH17 cells in culture and assessed for IL-17A and IFNγ production. Left plots show the distribution of GFP-negative and -positive CD4+ T cells with GFP gates for middle and right plots indicated by the boxed regions. Middle and right plots show the abundance of IL-17A-positive cells in GFP-negative (non-reconstituted Itk−/− cell) and GFP-positive (WT-Itk- or LS-Itk-reconstituted Itk−/− cell) populations respectively that produce low amounts of IFNγ, thereby defining the percent of TH17 cells. Data are representative of 3 experiments. DIC, Differential interference contrast; FSC, Foward scatter; MFI, Mean fluorescence intensity

