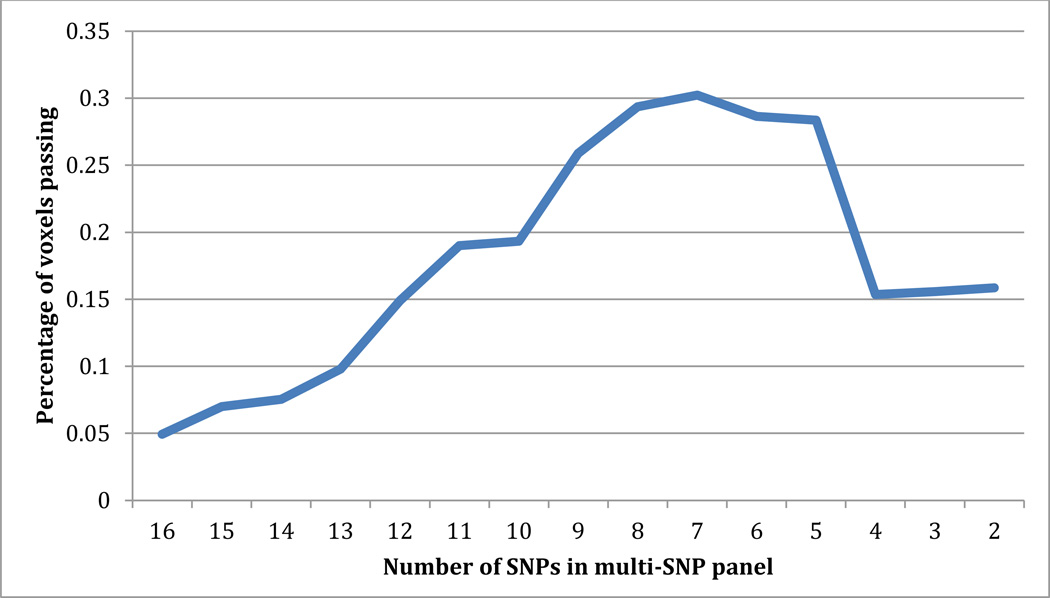
Figure 3. Results of iterative multi-SNP analysis.
Multi-SNP was run iteratively, removing the weakest SNP after each iteration to find the strongest panel of SNPs. The plot shows the number of SNPs included in the panel and the percentage of voxels passing searchlight FDR for each iteration. 7 SNPs was the strongest panel.

