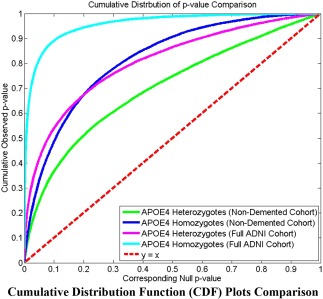
Figure 8.

Illustration of cumulative distribution functions of the P values observed for the contrast of APOE e4 carriers versus noncarriers, plotted against the corresponding P value that would be expected under null hypothesis of no group difference, for the four experiments shown in Figures 6 and 7. We note that the deviation of the statistics from the null distribution generally increases from heterozygotes vs. noncarriers to homozygotes vs. noncarriers in both the full ADNI cohort and nondemented cohort studies, suggesting that the APOE e4 allele dose may be associated with more accelerated atrophy of hippocampus. [Color figure can be viewed in the online issue, which is available at http://wileyonlinelibrary.com.]
