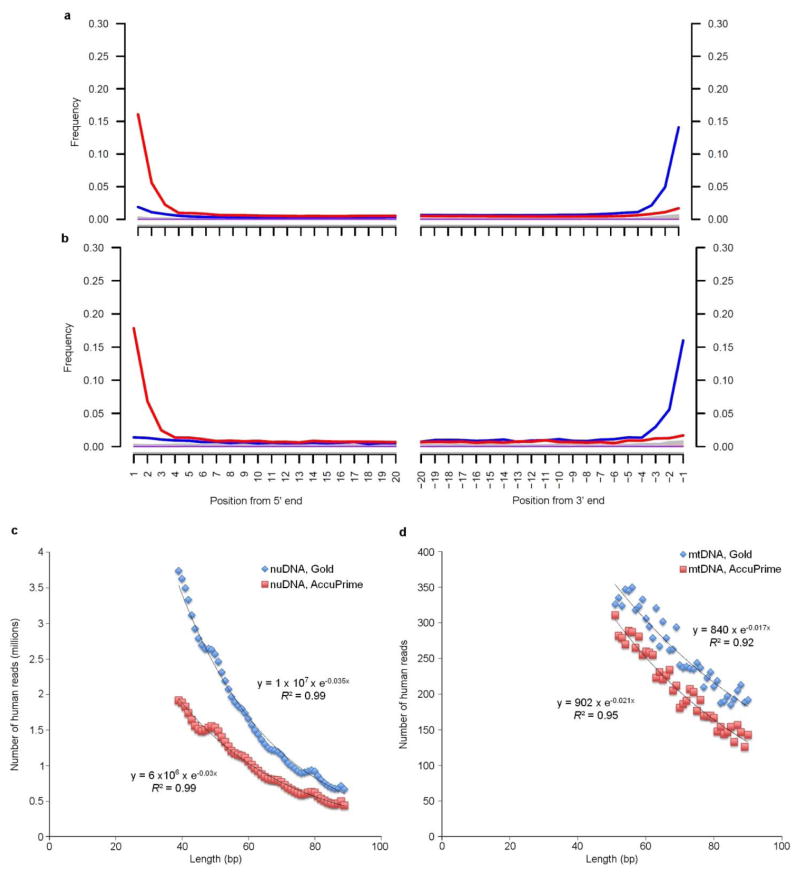
Extended Data Figure 2. Damage pattern of La Braña 1 sequenced reads.
Frequencies of C to T (red) and G to A (blue) misincorporations at the 5′ end (left) and 3′ end (right) are shown for the nuclear DNA (a) and mtDNA (b). Fragment length distribution of reads mapping to the nuclear genome (c) and mtDNA genome (d). Coefficients of determination (R2) for an exponential decline and damage fractions (λ) are provided for the four different datasets.

