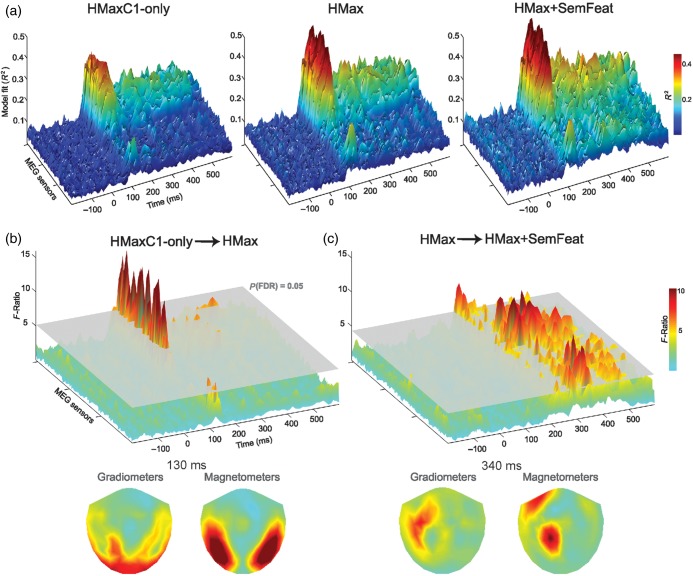
Figure 2.
Regression model fits. (a) Model fits across MEG sensors and time showing R2 values for the HMaxC1-only, HMax, and HMax + SemFeat models. (b) F-Ratio of the change in R2 from the HMaxC1-only to the HMax model, and (c) from the HMax model to the HMax + SemFeat model. Plots show the F-ratio across sensors and time with a significant change in F-ratio shown by the gray plane (P < 0.05 FDR corrected over time and sensors). Sensor topographies are shown for peak times for both magnetometers and the mean F-ratio over the planar gradiometer pairs.

