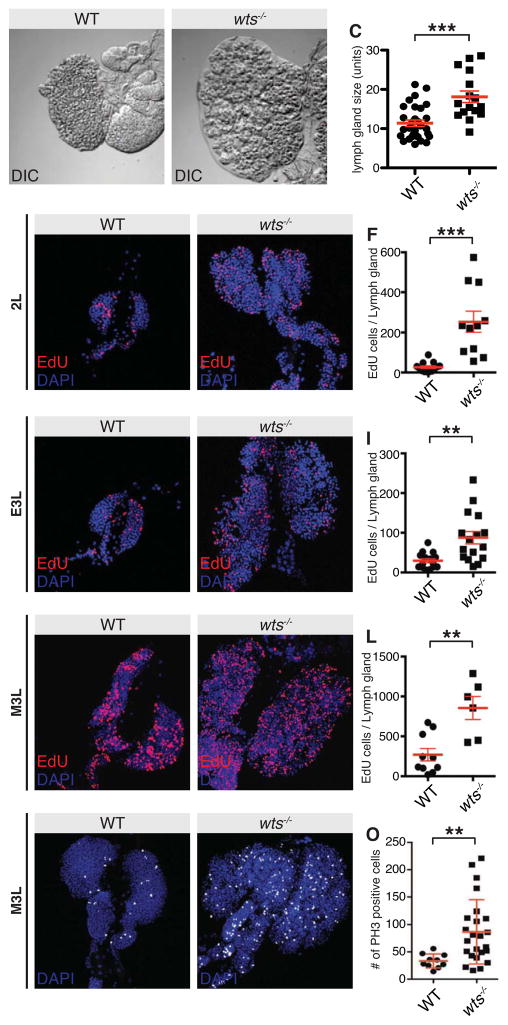
Figure 2. Warts regulates lymph gland size and hemocyte proliferation.
(A–C) Direct interference contrast images of control w1118 (A) and wts mutant late third instar lymph glands (B). Lymph gland size was quantified in (C). wts mutant lymph glands were significantly larger than controls (p<0.0001; n=30 for w1118, n=16 for wts-Z; error bars represent SEM).
(D–L) Control w1118 (D, G and J) and wts mutant lymph glands (E, H and K) at late second instar (D–E), early third instar (G–H) and mid third instar (J–K). Cells undergoing DNA replication were visualised using EdU (red in D, E, G, H, J and K) and nuclei were marked with DAPI (blue in D, E, G, H, J and K). The number of EdU positive cells per lymph gland was quantified in (F, I and L).
(M–O) Control w1118 (M) and wts (N) mutant mid third instar larval lymph glands. Mitotic cells were visualised using anti phospho-Histone H3 (white) and nuclei were marked with DAPI (blue). The number of phospho-Histone H3 positive cells per lymph gland was quantified in (O).
Scale bars = 20 μm. See also Figure S2.

