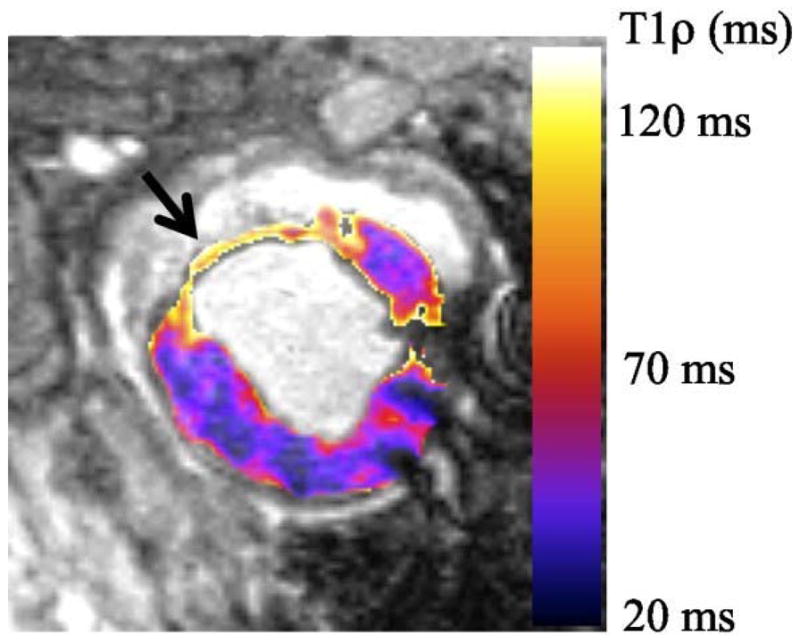
Fig. 15.

T1ρ relaxation time map from a single animal 8 weeks post-MI. The infarct 1H nuclear relaxation time in vivo are measured T1ρinfarct = 91.7 ms and T1ρmyocardium = 47.2ms. Relaxation time are twice as long in the myocardial infarction than the myocardium, which means that T1ρ-weighted images have high signal intensity at the infarct and low signal intensity in the myocardium. Figure reprinted from reference (132), Open Access article.
