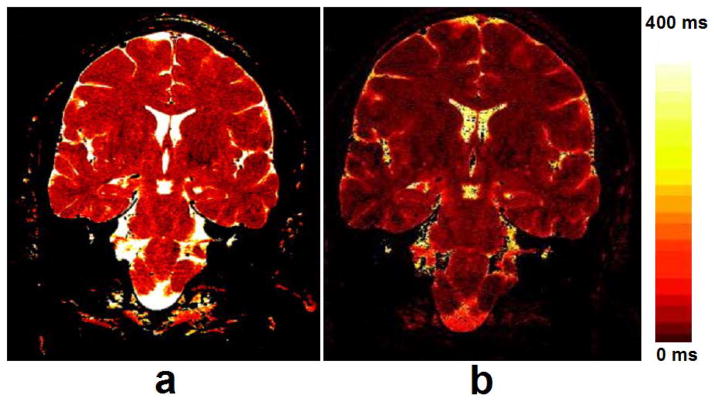
Fig. 16.
Images acquired at different TSL and TE values were used to calculate T1ρ (a) and T2 (b) maps, respectively. Note the greater dynamic range of the T1ρ map than the T2 map. The maps were windowed identically from 0–400 msec. Relaxation times greater than 400 msec are assigned the brightest color. Furthermore, pixels for which the linear fit’s correlation coefficient (R2) was less than 0.9 were set to zero, e.g., dark pixels inside the ventricles in the T2 map. Figure reprinted from reference (119), with permission.

