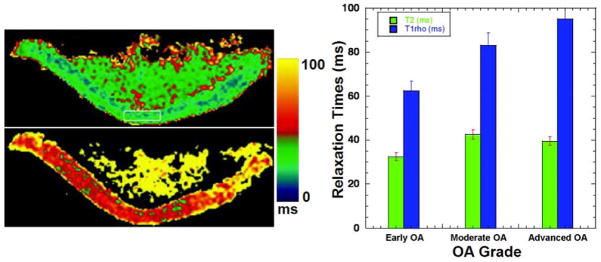
Fig. 5.

Representative T2 (upper row of left column) and T1ρ (lower row of left column) maps. T2 map constructed from a series of T2-weighted images obtained with parameters TR/TE = 4000 ms/15 ms, FOV = 7 cm × 7 cm, slice thickness = 3 mm, matrix = 512 × 128, NEX = 1. T1ρ map constructed from a series of T1ρ-weighted images of the same slice obtained with parameters TR/TE+TSL = 4000 ms/17 ms; FOV = 7 cm × 7 cm, slice thickness = 3 mm, matrix = 512 × 128, NEX = 1, and ω1 = 500 Hz. The color bar scale shows the relaxation time values distribution ranging from 0 ms to 100 ms; (right column) comparison of T2 and T1ρ relaxation times as a function of various clinical grades of OA cartilage (early OA, moderate OA, and advanced OA). Figure reprinted from reference (52), with permission.
