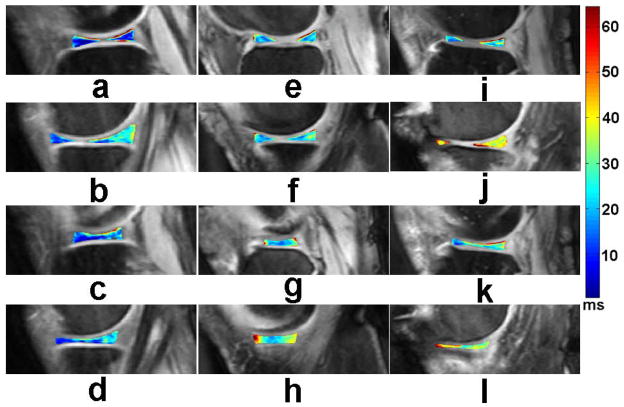
Fig. 7.
Representative T1ρ maps of menisci in the lateral (a, c, e, g, i, k) and medial (b, d, f, h, j, l) compartments, obtained from a healthy control (a, b, c, d), a minimal (KL2) OA patient (e, f, g, h), and a severe (KL4) OA patient (i, j, k, l), respectively. The color bar on the right shows the range of T1ρ values. The imaging parameters for 3D-T1ρ mapping were the same as those in Fig. 6.

