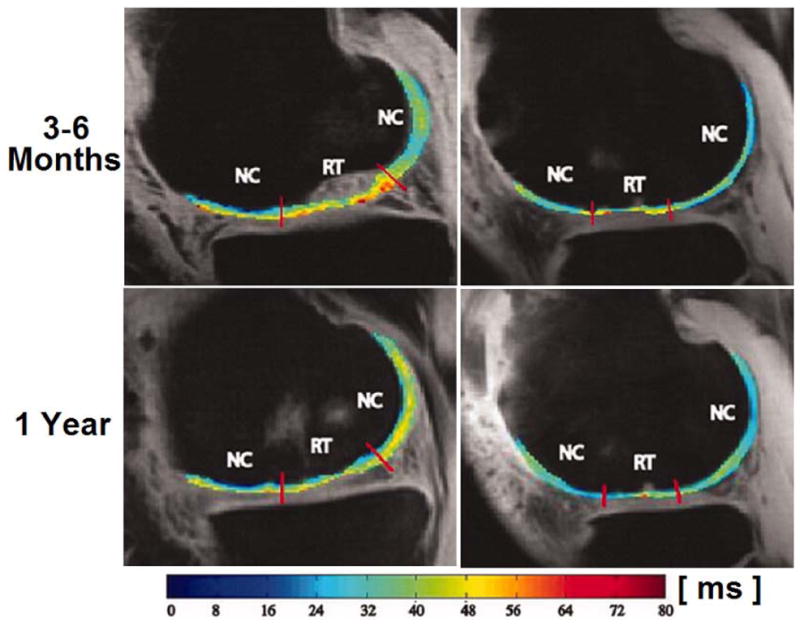
Fig. 9.

Representative T1ρ (left column) and T2 (right column) maps 3–6 months and 1 year after mosaicplasty (MOS) surgery. Colour bar scale shows T1ρ and T2 values range of distribution. NC, normal cartilage; RT, regenerated tissue. Figure reprinted from reference (88), with permission.
