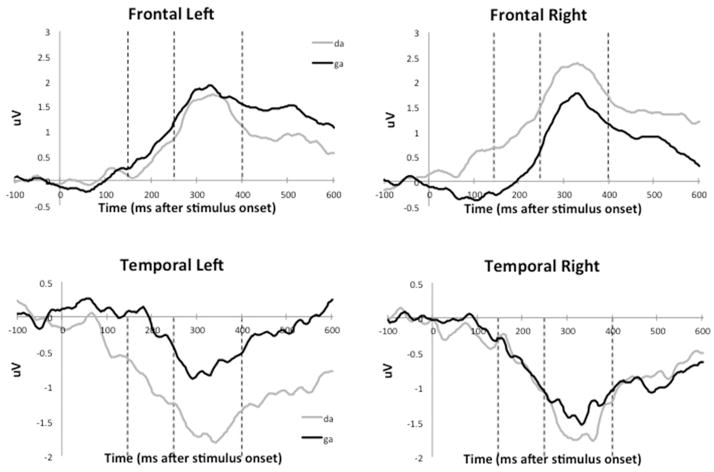
Figure 2. Event-related potential responses to speech sounds in intensive care neonates (Grand average waveforms of N = 45 patients).
Amplitude of the response to each of the sound stimuli in VV is represented by deflections from zero in the vertical axis. The frontal waveforms show a positive deflection after the stimulus onset while the temporal waveform shows a negative deflection reflecting the polarity reversal around the reference electrodes. The difference between the two tracings represents differences in cortical processes in response to the two sounds at various locations specified in Figure 1.

