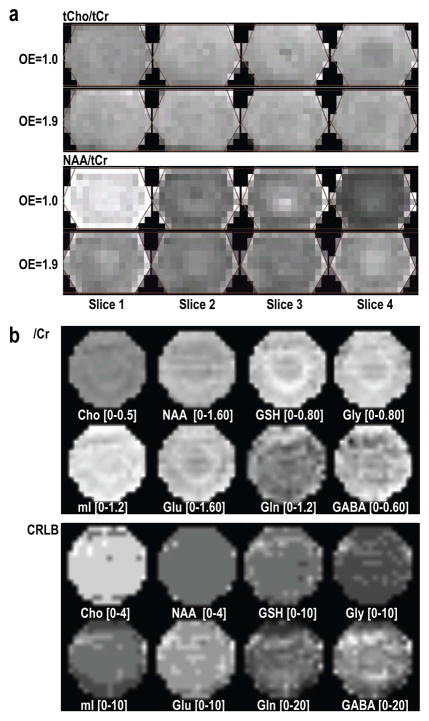
Figure 3.
Relative metabolite maps quantified using LCModel acquired from a GE MRS phantom (a) and a mixed metabolite phantom containing Cho, Cr, NAA, Glu, Gln, GABA, GSH, mI, Gly and Lac (b) to examine chemical shift misregistration (a) and accuracy of quantification (b). The spectra from the first slice have highest NAA/tCr, whereas those from the last slice have lowest levels (a, OE=1.0). Exciting larger than the encoded volume in the S/I direction (OE=1.9) significantly reduced this difference. Not only these singlets, but also the metabolites with complex coupling information, such as Glu, Gln, GABA, GSH, mI and Gly, were quantified and remarkably uniform in the spectra array with relatively small CRLB values.

