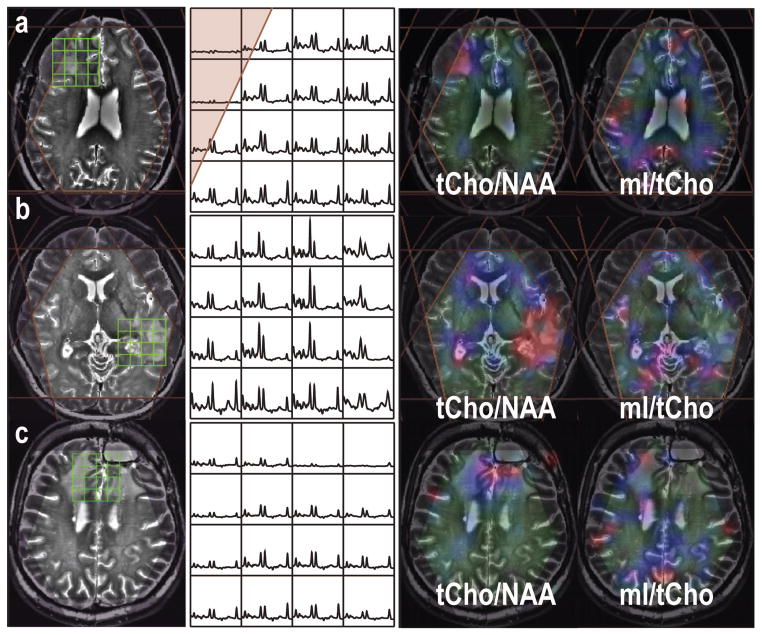
Figure 4.
MRSI data (baseline removed from LCModel) from three patients with grade IV, II and IV gliomas, who were prior to any treatment (a), recurrent within 10 months (b) and over 3 years (c), respectively. The metabolite maps were quantified using LCModel and plotted with the range between 0 and 0.36 for tCho/NAA and between 0 and 6 for mI/tCho. Higher tCho/NAA in the recent active tumor lesions, while mI/tCho was elevated in the region that had been diagnosed stable for a long period.

