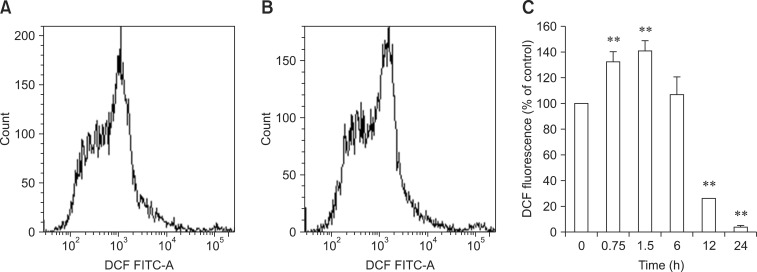
Fig. 3.
Effect of Cd on reactive oxygen species (ROS) production. Hepatocytes were treated with 5 µM of Cd for 45 min or 1.5, 6, 12, and 24 h. The cells were then stained with DCFH2-DA. Intracellular ROS levels were measured by flow cytometry as described in the Materials and Methods section. Results are expressed as a representative histogram (A, control; B, 5 µM Cd; respectively 1.5 h) and mean fluorescence obtained from the histogram statistics (C). Each bar represents the mean ± SD (n = 3). **p < 0.01 and *p < 0.05 compared to the control. DCF: dichlorofluorescein, FITC: fluorescein isothiocyanate.

