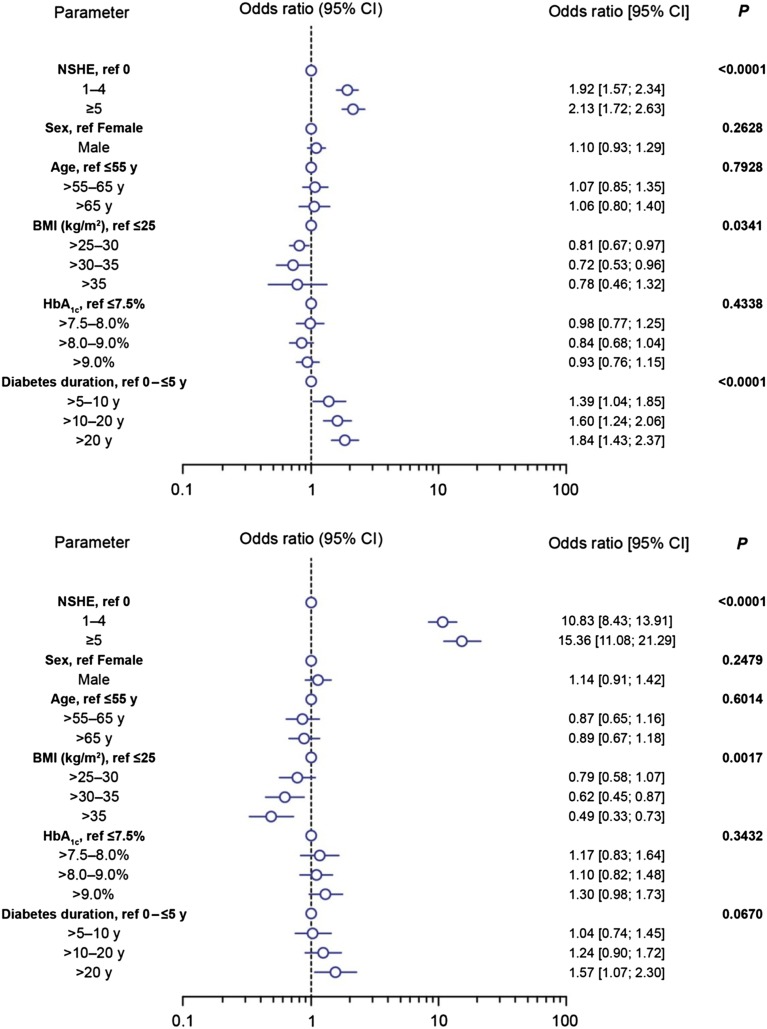
Fig. 2.
Adjusted odds ratio estimates for experiencing ≥1 SHEs for T1DM (top) and T2DM (bottom), at baseline in the PREDICTIVE study. P values are for the covariate named on the left. BMI body mass index, CI confidence interval, HbA 1c glycosylated hemoglobin, NSHE non-severe hypoglycemic event, SHE severe hypoglycemic event, T1DM type 1 diabetes mellitus, T2DM type 2 diabetes mellitus

