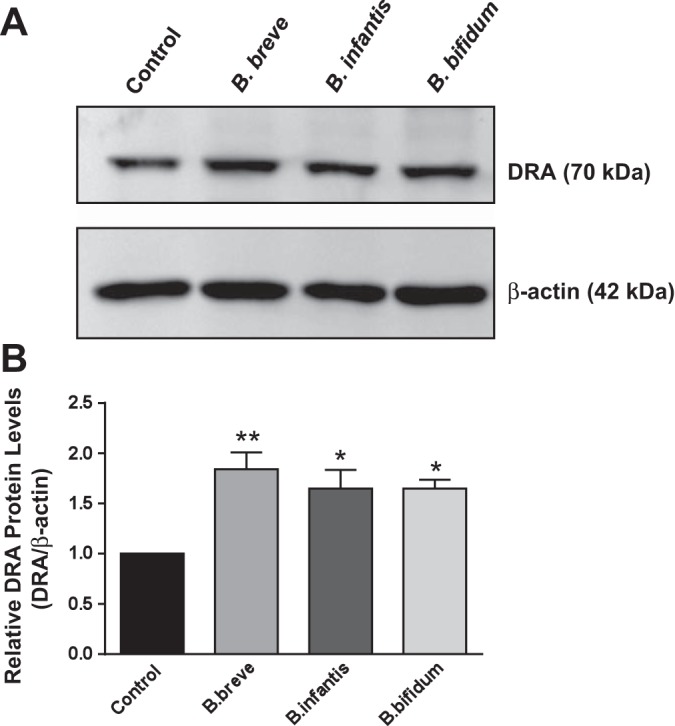
Fig. 3.

DRA protein expression in response to long-term treatment with Bifidobacterium sp. CS. A: Western blot analysis of postconfluent Caco-2 cells treated with B. breve, B. infantis, or B. bifidum CS (diluted 1:2 in DMEM-F12 medium) for 24 h. B: densitometry analysis of intensity of DRA protein normalized to β-actin. Values are means ± SE of 4 independent experiments. *P < 0.05, **P < 0.01 vs. control.
