
Fig. 1.
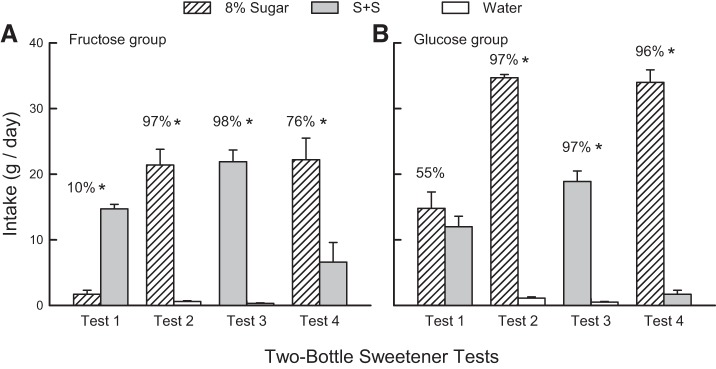
Experiment 1. Oral sweetener two-bottle preference tests. A: mice from the Fructose Group were given 2-day choice tests with 8% fructose vs. 0.1% sucralose + 0.1% saccharin (S+S) (test 1), 8% fructose vs. water (test 2), S+S vs. water (test 3), and 8% fructose vs. S+S (test 4). B: mice in the Glucose Group were similarly tested but with 8% glucose and S+S. Values are expressed as means ± SE daily intakes averaged across each 2-day test. Numbers atop bars represent mean percent preference for the solution represented by that bar. Significant intake differences (*P < 0.05) within two-bottle tests are shown.