
Fig. 5.
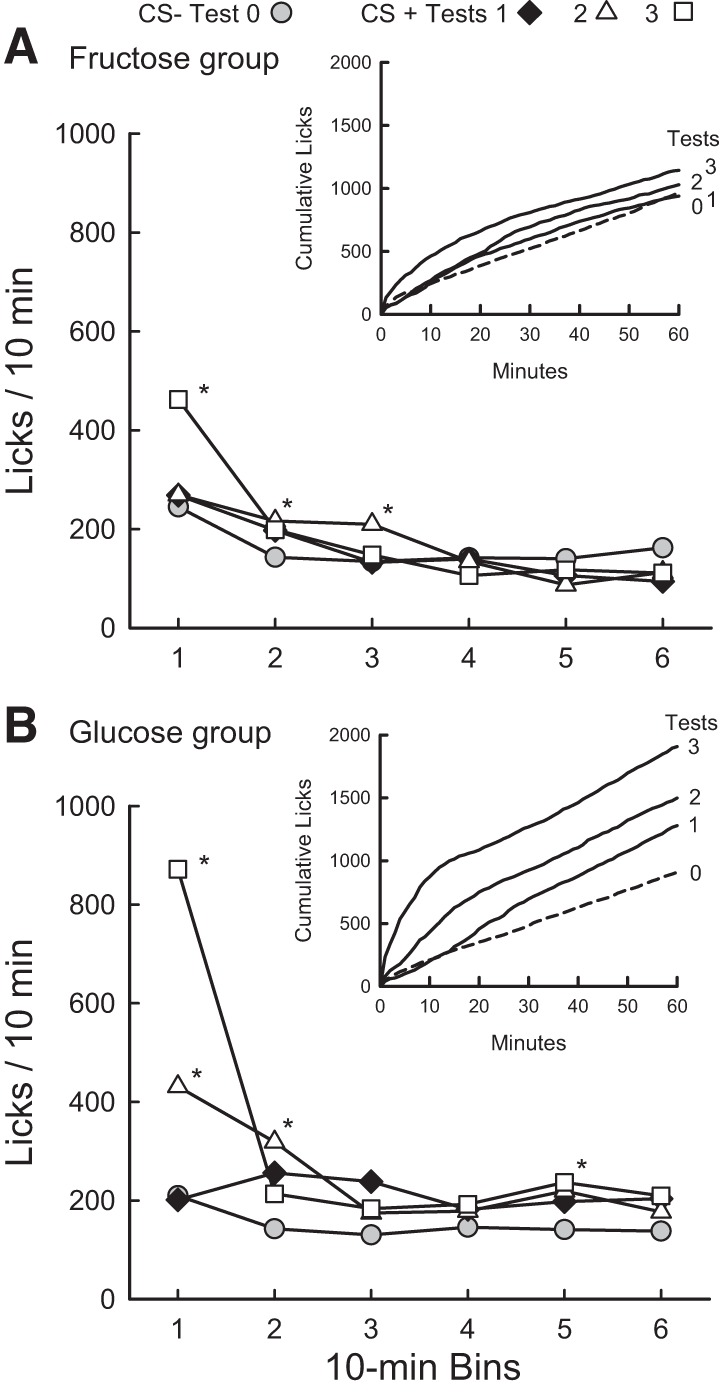
Experiment 3. IG sugar conditioning in food-restricted FVB mice trained 1 h/day. Mean licks per 10-min bin are plotted for test 0 (mean of last two 1-h sessions) with CS− flavored saccharin solution paired with IG water self-infusions, and for tests 1–3 with CS+ flavored saccharin solution paired with IG self-infusions of 16% fructose (A) or 16% glucose (B). Graph insets plot mean cumulative lick curves for tests 0–3. For the Fructose Group, 10-min licks in bins 2 and 3 of test 2 and licks in bin 1 of test 3 significantly (*P < 0.05) exceeded those of test 0. For the Glucose Group, 10-min licks in bins 1, 2 and 5 of test 2 and licks in bins 1 and 5 of test 3 exceeded those of test 0 (*P < 0.05).