Fig. 4.
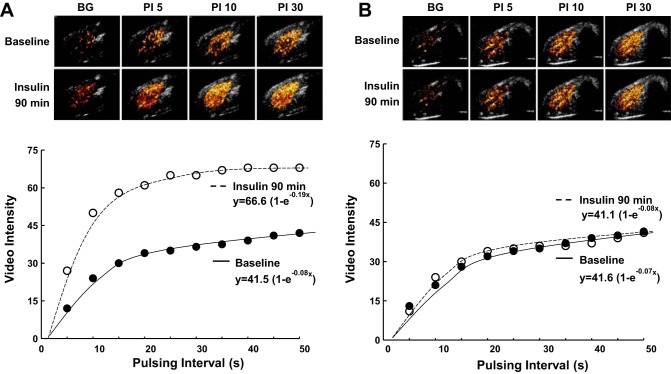
Examples of background-subtracted, color-coded, contrast-enhanced ultrasound (CEU) images from rat hindlimb skeletal muscle and corresponding time (pulsing interval) vs. video intensity curves at baseline and after 90 min of euglycemic hyperinsulinemia in a control rat (A) and a MS-PPOH-treated rat (B). See text for details.

