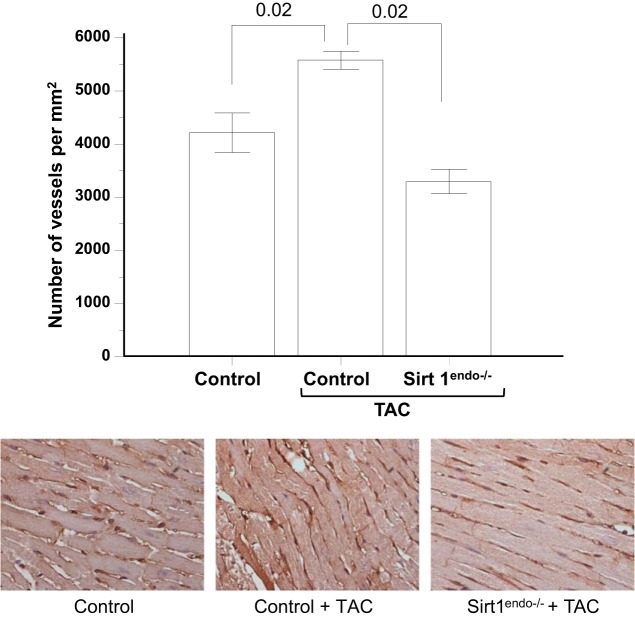
Fig. 10.
CD31 staining (brown stain) in the LV of control animals without surgery, control animals with TAC, and Sirt1endo−/− TAC animals 7 wk after surgery. Quantification of the CD31 staining is presented in the bar graph as the number of vessels per square millimeter. Note that the capillary density in the control TAC animals increased, but the opposite occurred in the Sirt1endo−/− TAC group of mice.

