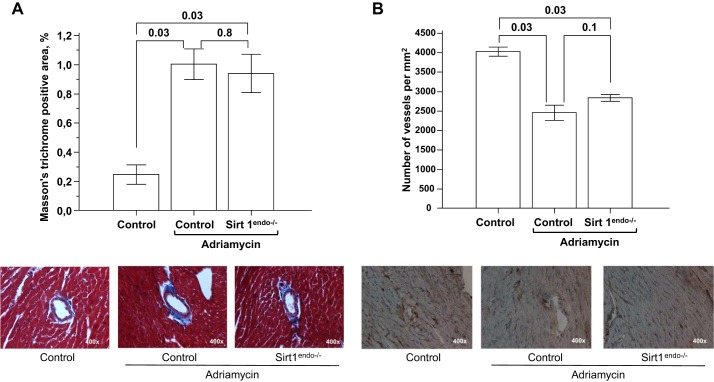
Fig. 14.
A: Masson's trichrome staining (blue stain) in the LV of control animals without Adriamycin, control animals with Adriamycin, and Sirt1endo−/− Adriamycin animals 9 wk after the beginning of treatment. Quantification of fibrosis is presented in the bar graph as % of Masson's trichrome-positive area. B: CD31 staining (brown stain) in the LV of control animals without Adriamycin, control animals with Adriamycin, and Sirt1endo−/− Adriamycin animals 9 wk after the beginning of treatment. Quantification of CD31 staining is presented in the bar graph as the number of vessels per square millimeter.

