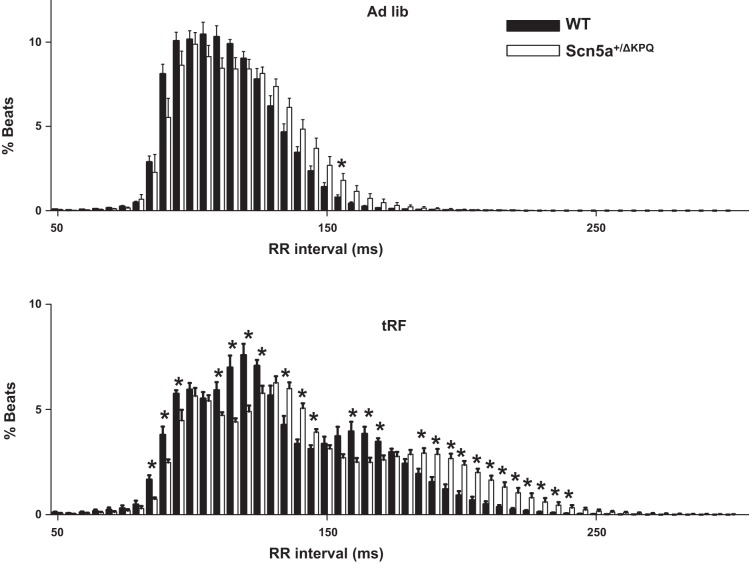
Fig. 3.
Time-restricted feeding unmasks slower RR intervals in the Scn5a+/ΔKPQ mice. Histogram plots for the distribution of RR intervals from WT (black bars) or Scn5a+/ΔKPQ (white bars) mice in ad libitum-fed (top) or tRF conditions (bottom). The RR intervals are separated into 5-ms bins (*P < 0.05; n = 6 animal each).

