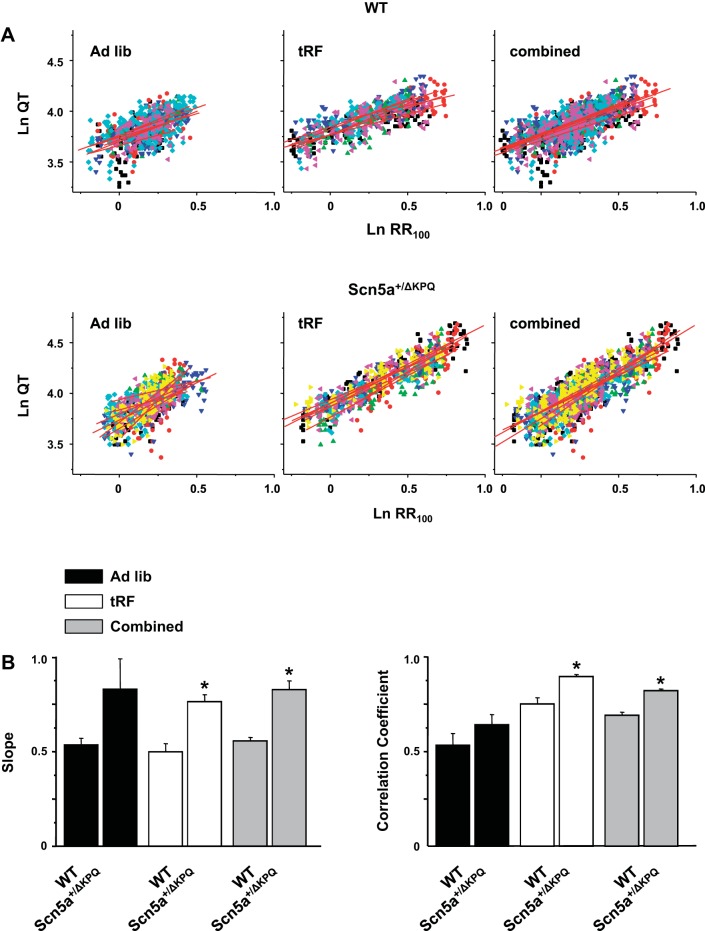
Fig. 5.
The power of the QT-RR100 relation is steeper for Scn5a+/ΔKPQ mice. A: power of the relation between the QT and RR intervals for the WT (top) or Scn5a+/ΔKPQ (bottom) mice calculated in ad libitum-fed (left), tRF (middle), or combined ad libitum-fed and tRF (right) conditions. Each animal is highlighted as a different colored symbol, and red line shows the corresponding fits (n = 6 to 7 for WT and Scn5a+/ΔKPQ, respectively). B: mean slopes (left) and correlation coefficients (right) for the ad libitum-fed, tRF, or combined conditions (*P < 0.05 for WT vs. Scn5a+/ΔKPQ).

