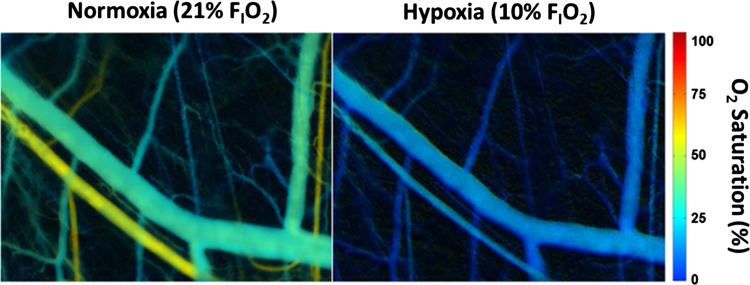
Fig. 4.
Representative images mapping in vivo oxygenation during RBC transfusion experiments. The microvascular network of nude mice following transfusion of human RBCs was imaged via brightfield microscopy with a tunable wavelength filter. Hb O2 saturation was calculated by measuring the absorption of light over the visible spectrum and calculating the amount of oxy- and deoxyHb. Left: nasal inhalation of 21% O2; right: inhalation of 10% O2 by the same mouse. Color scaling on the far right demonstrates the percent Hb O2 saturation of blood within the microvascular network. HbO2 saturations <75% during normoxia are anticipated given O2 distribution in the microcirculation, anesthesia effects, and the high p50 of mouse RBCs (8, 14, 34). FiO2, inspired O2 fraction.

