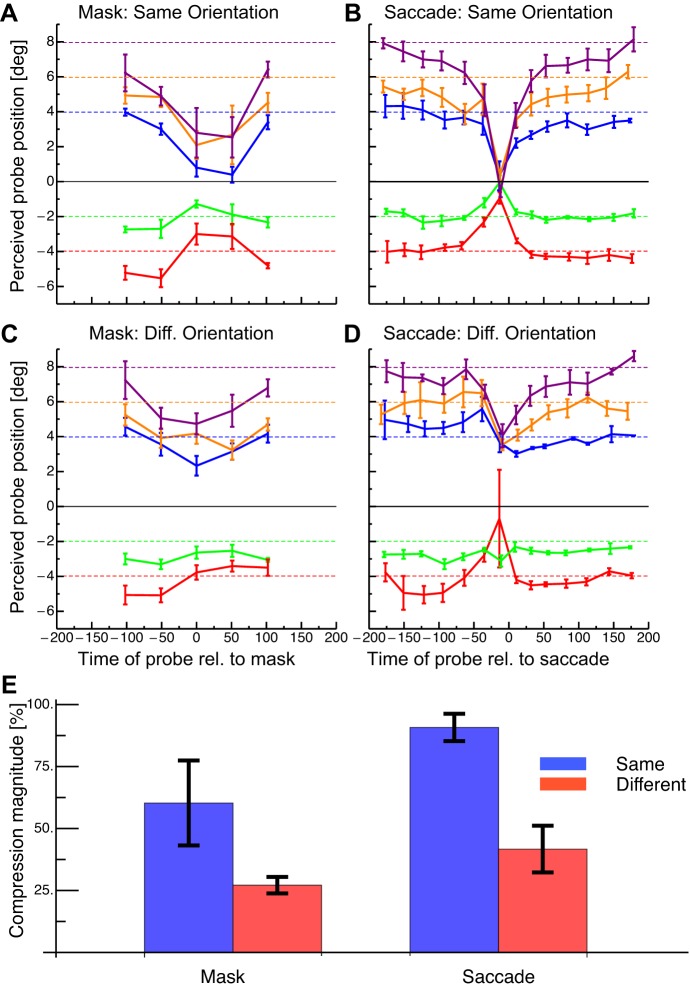
Fig. 2.
Average results of the space compression experiment. Negative time intervals on x-axis: probe before the mask/saccade and positive intervals on x-axis: probe after the mask. A: results in the fixation condition with same oriented probe and anchor stimuli. Dashed lines refer to physical probe positions. Error bars represent SE. B: results in the saccade condition with same oriented probe and anchor stimuli. Same conventions as in A. C: results in the fixation condition with different oriented probe and anchor stimuli. Same conventions as in A. D: results in the saccade condition with different oriented probe and anchor stimuli. Same conventions as in A. E: compression indexes from the fixation and saccade experiments with same and different oriented stimuli. Error bars represent SE.

