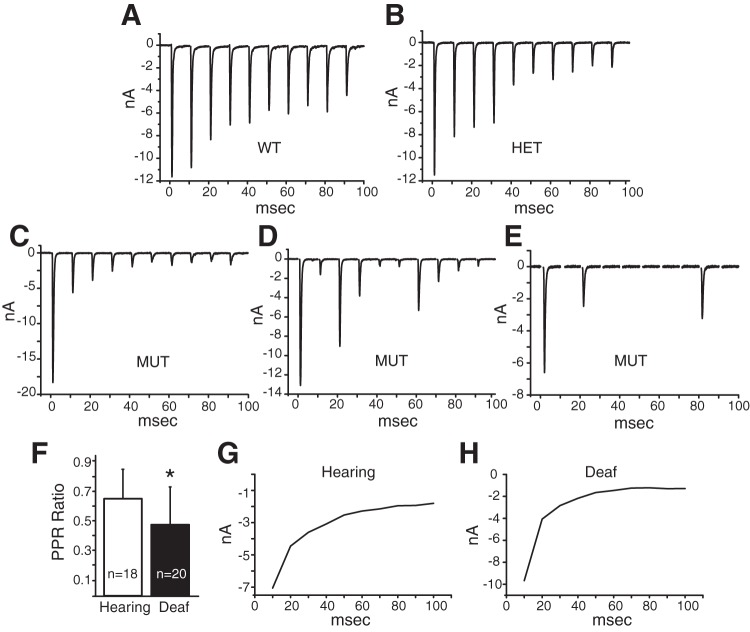
Fig. 12.
Trains of eEPSCs. A: in a bushy cell from a wild-type mouse, eEPSCs in response to a single train of 10 shocks at 100 Hz became increasingly smaller, showing the existence of depression. B: in a bushy cell from a heterozygote mouse, depression was similar to that in the wild type. C–E: eEPSCs in bushy cells from deaf mice in responses to stimuli at 100 Hz depress more and sometimes fail altogether. F: the paired-pulse ratio (PPR), the ratio of the amplitude of the eEPSC in response to the second stimulus divided by the amplitude of the eEPSC to the first stimuli, is a measure of synaptic depression. Hearing animals had higher PPRs than deaf mice (P = 0.03). G and H: average values of eEPSCs in bushy cells from hearing and deaf mice show that depression is greater and faster at end bulb-bushy cell synapses in deaf than in hearing mice. Averages were generated by averaging the responses to the first train of stimuli in each cell and then averaging responses across the population of bushy cells. Stimulus artifacts have been removed. *Statistically significant difference.

