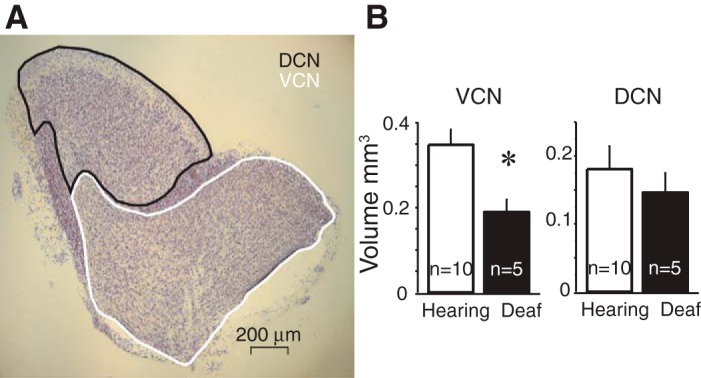
Fig. 3.

Volumes of cochlear nuclei. A: photomicrograph of a parasagittal section, 60 μm thick, through the cochlear nuclei that had been stained with cresyl violet. The ventral (VCN) and dorsal (DCN) cochlear nuclei are outlined. B: areas were summed across serial sections and multiplied by 60 μm to determine volumes. Average volumes are shown in histograms illustrating the average volume difference of 5 mice from each Otoferlin genotype. The volumes of the VCN were significantly smaller in deaf Otoferlin mutant mice than in hearing control mice (P < 0.001). The difference in the volumes of the DCN was not significant. *Statistically significant difference.
