
Fig. 1.
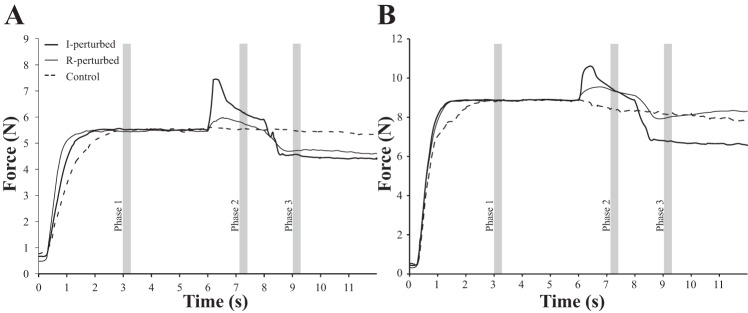
Average force profiles for a representative subject during the index (I; A) and index + middle (IM; B) pressing conditions. The perturbation onset at 6 s corresponded with removal of visual feedback in all conditions (including the no-perturbation conditions). The phase 1, phase 2, and phase 3 markings denote the time periods during which data were analyzed. R, ring finger.