
Fig. 2.
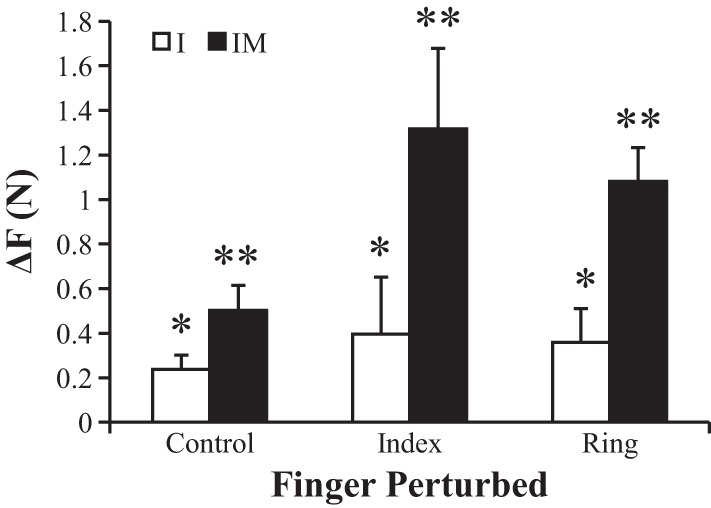
The decrease in total force from phase 1 to phase 3 for each perturbation and finger pressing condition. Positive values indicate that subjects produced less force in phase 3 than in phase 1. *Significant differences between conditions. **Significant differences between perturbations. Average across subjects data are shown with SE bars.