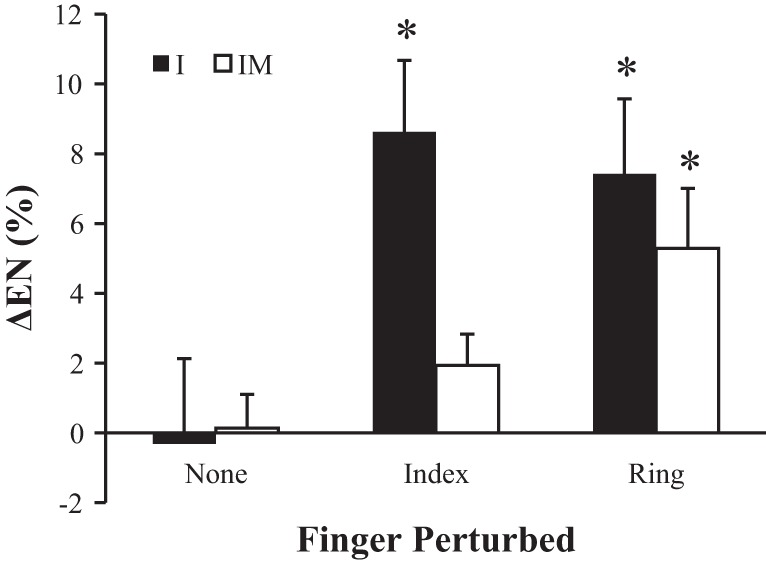
Fig. 3.

The change in enslaving from phase 1 to phase 3. Enslaving (EN) is presented as the percentage of total force produced by noninstructed fingers. Positive values indicate that noninstructed fingers produced a greater amount of total force during phase 3 than phase 1. *Values that are significantly different from zero. Average across subjects data are shown with standard error bars.
