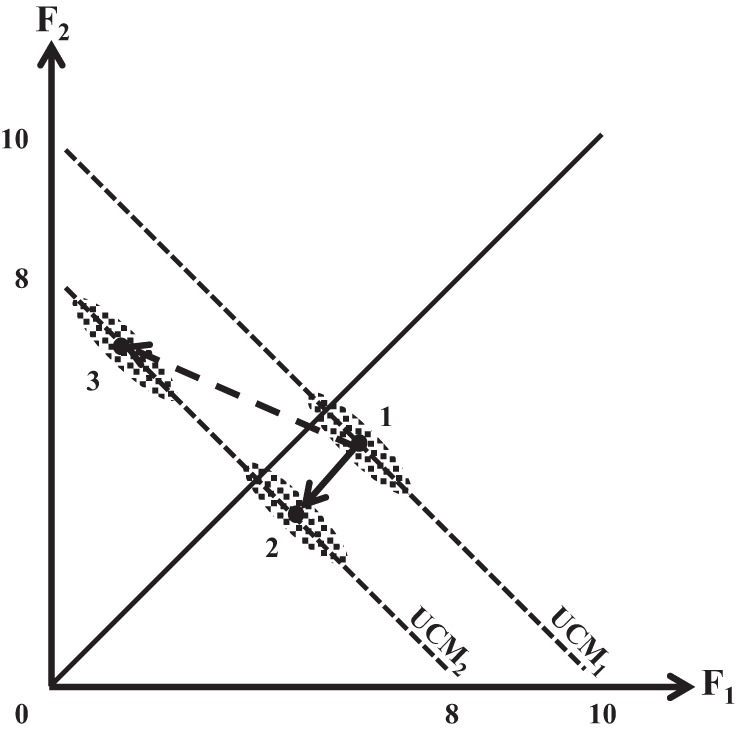
Fig. 7.

A schematic illustration of a 2-finger force production task from an initial value (on average, 10 N) to a lower value (on average, 8 N). Intertrial variance is illustrated with ellipses of data points; the ellipses are elongated along the corresponding uncontrolled manifolds (UMC1 and UCM2) leading to VUCM > VORT. Two force trajectories are shown, with (dashed) and without (solid) a ME component.
