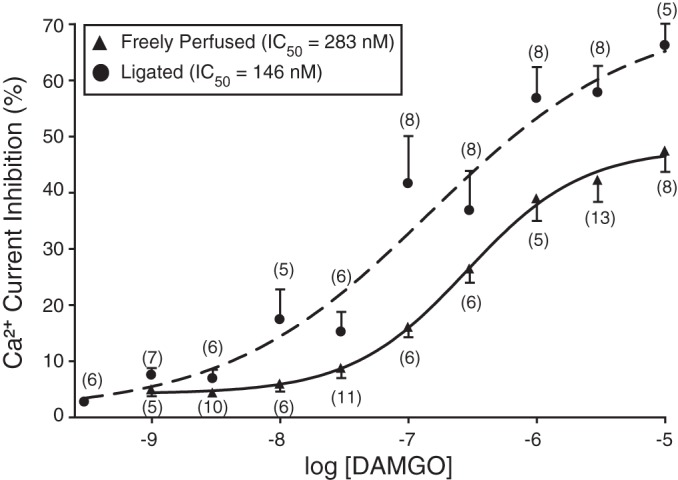
Fig. 7.

DAMGO concentration-response relationships of DRG neurons from rats with freely perfused (▲) and 72 h-ligated (•) femoral arteries (see Fig. 6 legend for details). Each data point represents the mean (±SE) prepulse Ca2+ current inhibition; the numbers in parentheses indicate the number of neurons that was tested. The smooth curves were obtained by fitting the data points to the Hill equation, and the calculated IC50 values are shown in the figure key.
