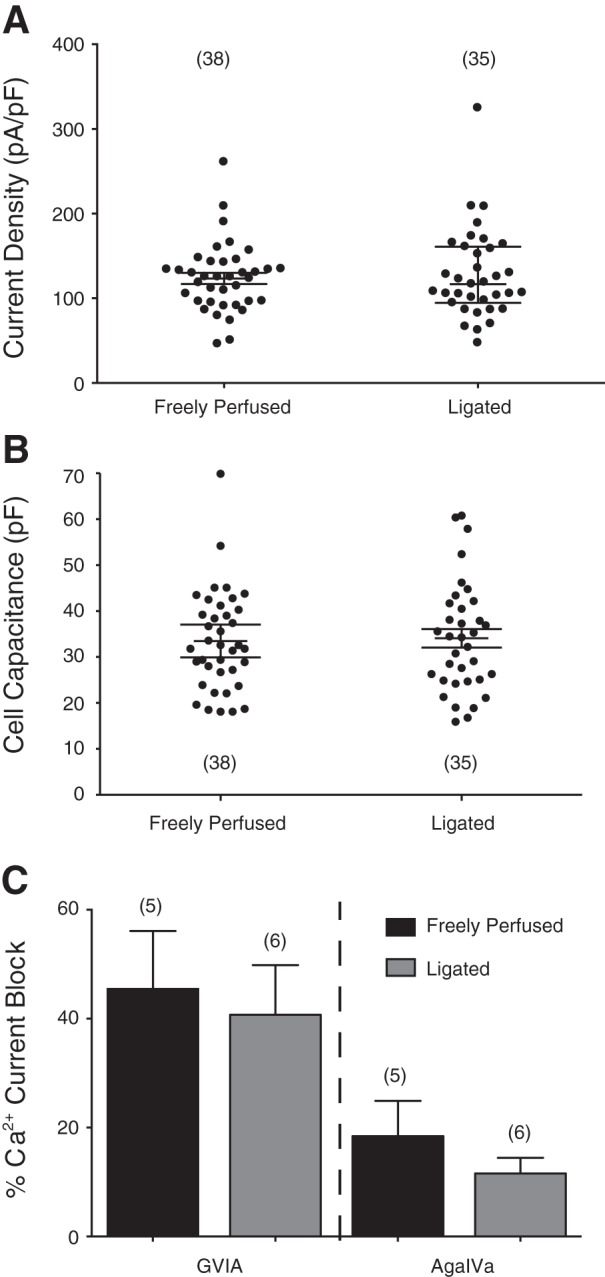
Fig. 8.

A and B: summary scatter plots of Ca2+ current density (pA/pF) and membrane capacitance (pF) in acutely isolated DiI-labeled and EGFP-expressing DRG neurons from rats with freely perfused and 72 h-ligated femoral arteries. Current density was calculated from the peak Ca2+ current amplitude normalized to membrane capacitance. The lines on the plots indicate the means (±SE), and the numbers in parentheses indicate the number of neurons tested. C: summary plot of the mean (±SE) Ca2+ current inhibition produced by the N (ω-conotoxin GVIA; 10 μM)- and P/Q [ω-agatoxin IVA (AgaIVa]; 0.2 μM)-type Ca2+ channel blockers in DRG neurons from freely perfused and ligated rats. The number of cells tested is indicated in parentheses.
