Fig. 4.
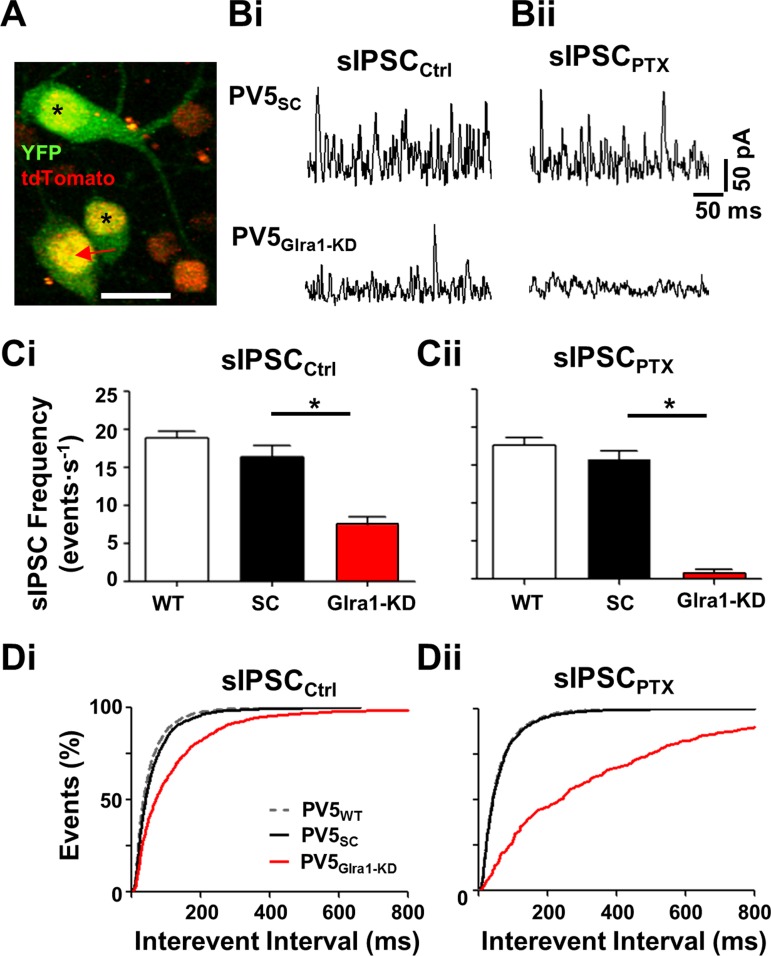
Knockdown of Glra1 eliminates GlyRα1 sIPSCs in PV5 RGCs. A: representative 2-photon Z-stack image of a PV5Glra1-KD RGC infected by AAV-Glra1-shRNA (arrow) that expresses YFP (green) in its cytoplasm and nucleus and tdTomato (yellow) in its nucleus. Double-labeled cells (asterisks) represent other PVcre RGC types. Single-labeled RGCs represent infected non-PVcre RGC types (red). Scale bar, 40 μm. Bi: representative sIPSCs in PV5SC and PV5Glra1-KD RGCs. Bii: representative sIPSCs of the same RGCs in the presence of PTX (20 μM). Ci: in control solution, the average sIPSC frequency in PV5Glra1-KD RGCs (n = 7) is significantly lower compared with PV5WT (n = 7) and PV5SC (n = 5) RGCs, which are similar. Cii: in the presence of PTX, the average sIPSC frequency in PV5Glra1-KD RGCs (n = 7) is also significantly lower compared with PV5WT (n = 7) and PV5SC (n = 5) RGCs, which are similar. The sIPSC frequency in PV5Glra1-KD RGCs is significantly reduced in control vs. PTX. *P < 0.05. D: interevent intervals in PV5Glra1-KD RGC sIPSCs are longer than PV5SC RGCs in control (Di) and in the presence of PTX (Dii). Interevent intervals in PV5Glra1-KD RGCs are significantly longer in control vs. PTX.

