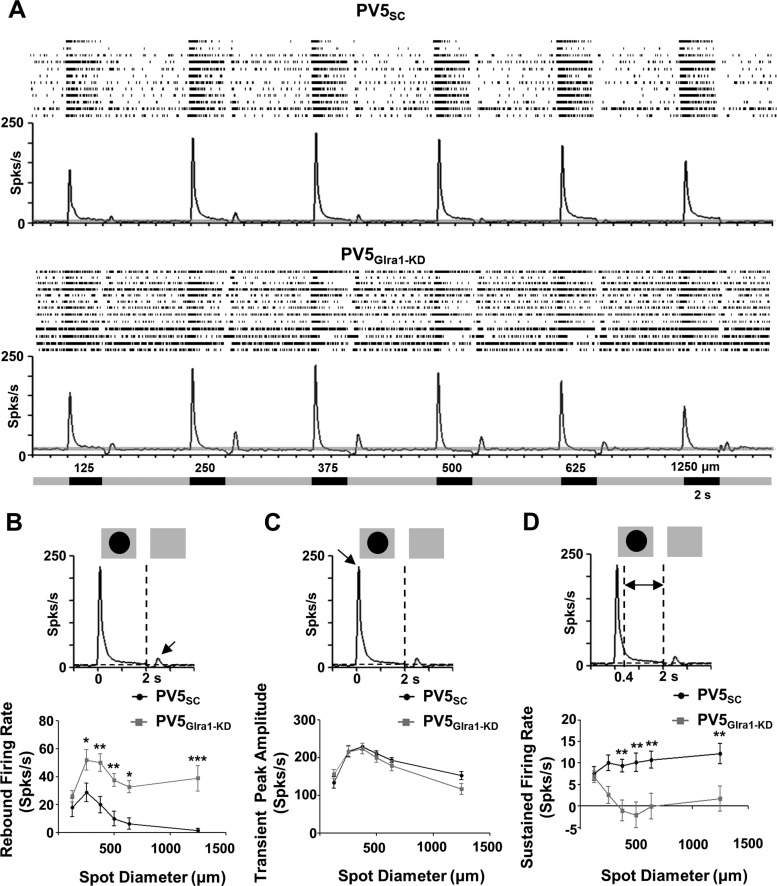
Fig. 6.
GlyRα1 input modulates PV5 RGC spontaneous activity (SA) and excitatory rebound poststimulus suppression to a luminance increment. A: average poststimulus time histograms (PSTHs) and individual raster plots (top) of the spiking responses of PV5SC (n = 12) and PV5Glra1-KD (n = 13) RGCs as a function of spot diameter. Mean SA is indicated by horizontal dashed lines on the PSTHs, and gray shading indicates ±2 SE. Spot diameter and the onset/offset of the stimulus are represented in the diagram below the responses. B: to a luminance increment, the transition between the presence of a dark spot and the background, rebound firing rates are significantly higher and the rebound response is retained across spot diameter in PV5Glra1-KD compared with PV5SC RGCs. C and D: transient peak amplitude (C) does not differ between the 2 groups, while sustained firing rates (D) of PV5Glra1-KD RGCs are significantly lower than those PV5SC RGCs. *P < 0.05, **P < 0.01, ***P < 0.001.

