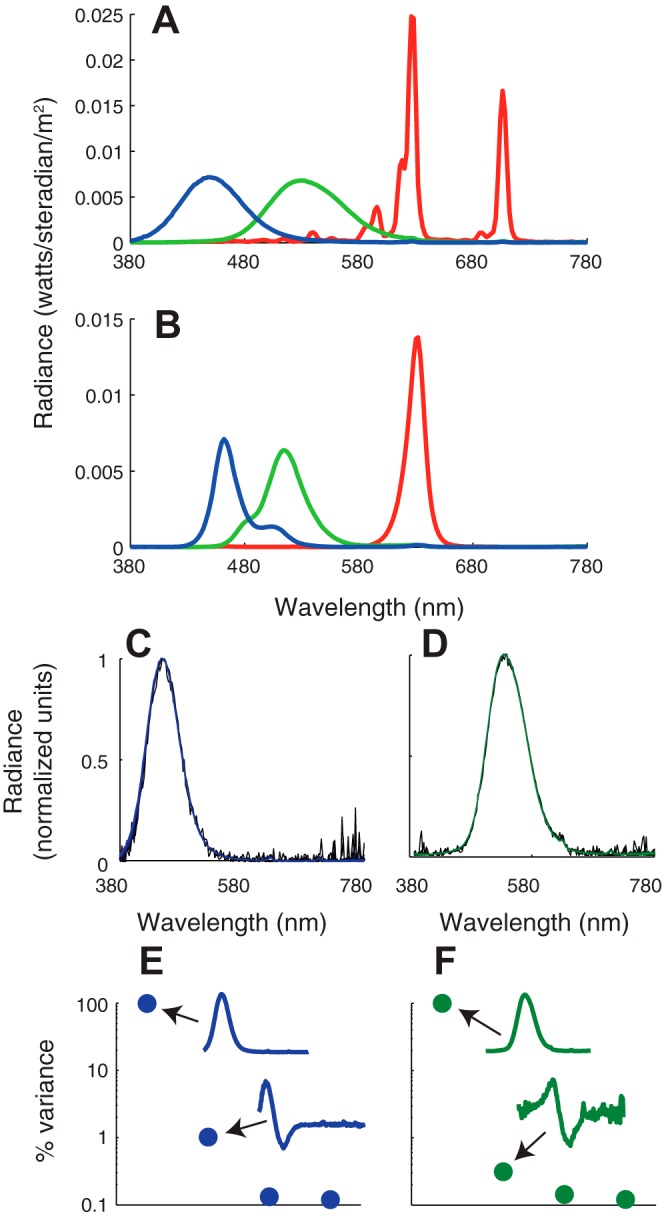
Fig. 2.

Light emission spectra from the cathode-ray tube (CRT; A) and wide-gamut liquid-crystal display (LCD; B) measured on the gray background used in experiments 1 and 2. Commission Internationale de l'Éclairage chromaticity coordinates (x, y) for each light are as follows: redCRT (0.63, 0.34), greenCRT (0.29, 0.61), blueCRT (0.15, 0.07), redLCD (0.69, 0.30), greenLCD (0.14, 0.63), blueLCD (0.14, 0.10). Modulation of the blue CRT phosphor on the equal energy white background produced cone contrasts in ratios 0.11:0.20:0.97 (L/M/S). Modulation of the green CRT phosphor produced cone contrasts in ratios 0.63:0.77:0.08. C: blue CRT phosphor spectra measured at 30 intensity values spanning the dynamic range. Each overlaid spectrum was corrected for ambient light (the dark light spectrum was subtracted) and normalized to peak at 1. D: same as C, but for the green phosphor. E: percentage of total variance accounted for by the four largest eigenvectors from a singular value decomposition of the matrix of spectral measurements. The largest two eigenvectors are shown in insets. F: same as E, but for the green phosphor.
