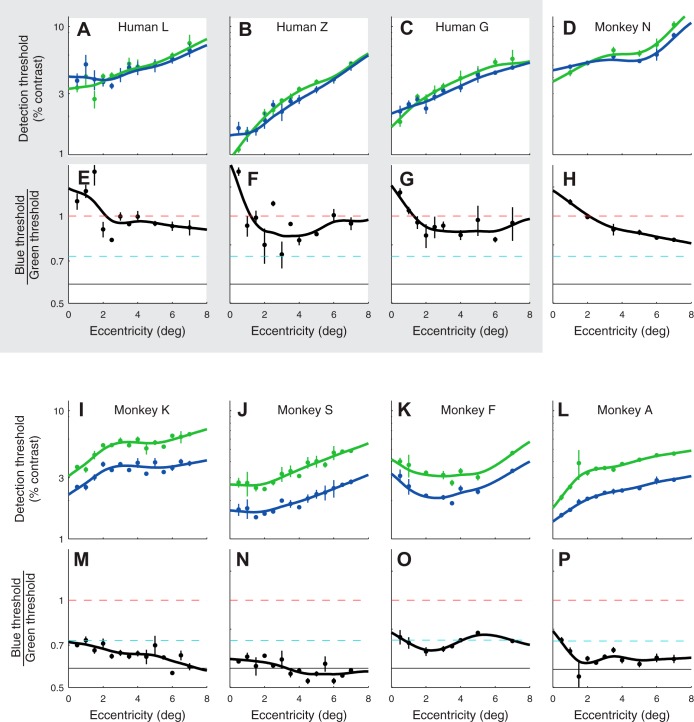
Fig. 3.
Detection thresholds for 15-Hz modulations of the blue and green phosphor for 3 human subjects (shaded region; A–C, E–G) and 5 monkey subjects (nonshaded region; D and H–P). For each subject, top panels (A–D and I–L) show thresholds (blue and green points) and smoothing spline fits (curves). Bottom panels (E–H and M–P) show the ratio of blue and green thresholds (black dots) and the ratio of the fitted splines (curves). Dashed lines in bottom panels illustrate the spectral sensitivity of the three theoretical observers from Fig. 1 (red: 2° 1.98L+M fundamentals, cyan: 10° L+M fundamentals, black: 10° L+M fundamentals with lens density = 1 at 400 nm). Error bars are SE.

